Tutorial: Barnase-Barstar Binding
Complete walkthrough — crystal structure to structured binding analysis.
▶ SYSTEM OVERVIEW — PDB: 1BRS — canonical protein-protein binding
Barnase (A,B,C)
110 residues each
RNase enzyme, the inhibited partner.
Barstar (D,E,F)
89 residues each
Barnase inhibitor, the binding partner.
CG Mapping
4640 atoms → 76 beads
6 entities, 3 biological pairs: D-A, E-B, F-C.
step 1: configure
▶ CONFIGURATION — example multi-stage evaluation file
[system]
name = "barnase_barstar"
pdb_source = "benchmarks/reference_cases/data/1BRS.pdb"
output_dir = "outputs/barnase_barstar_eval"

[dynamics]
stages = ["nvt", "npt", "production"]

[dynamics.nvt]
steps = 5000
time_step = 0.02
temperature = 300.0
ensemble = "NVT"

[dynamics.npt]
steps = 5000
time_step = 0.02
temperature = 300.0
ensemble = "NPT"

[dynamics.production]
steps = 100000
time_step = 0.02
temperature = 300.0
eval_stride = 50
step 2: run
▶ RUN
neurocgmd run examples/barnase_barstar_eval.tomlImport structure → preparation stages → production stage → back-mapping → analysis output
step 3: sample output
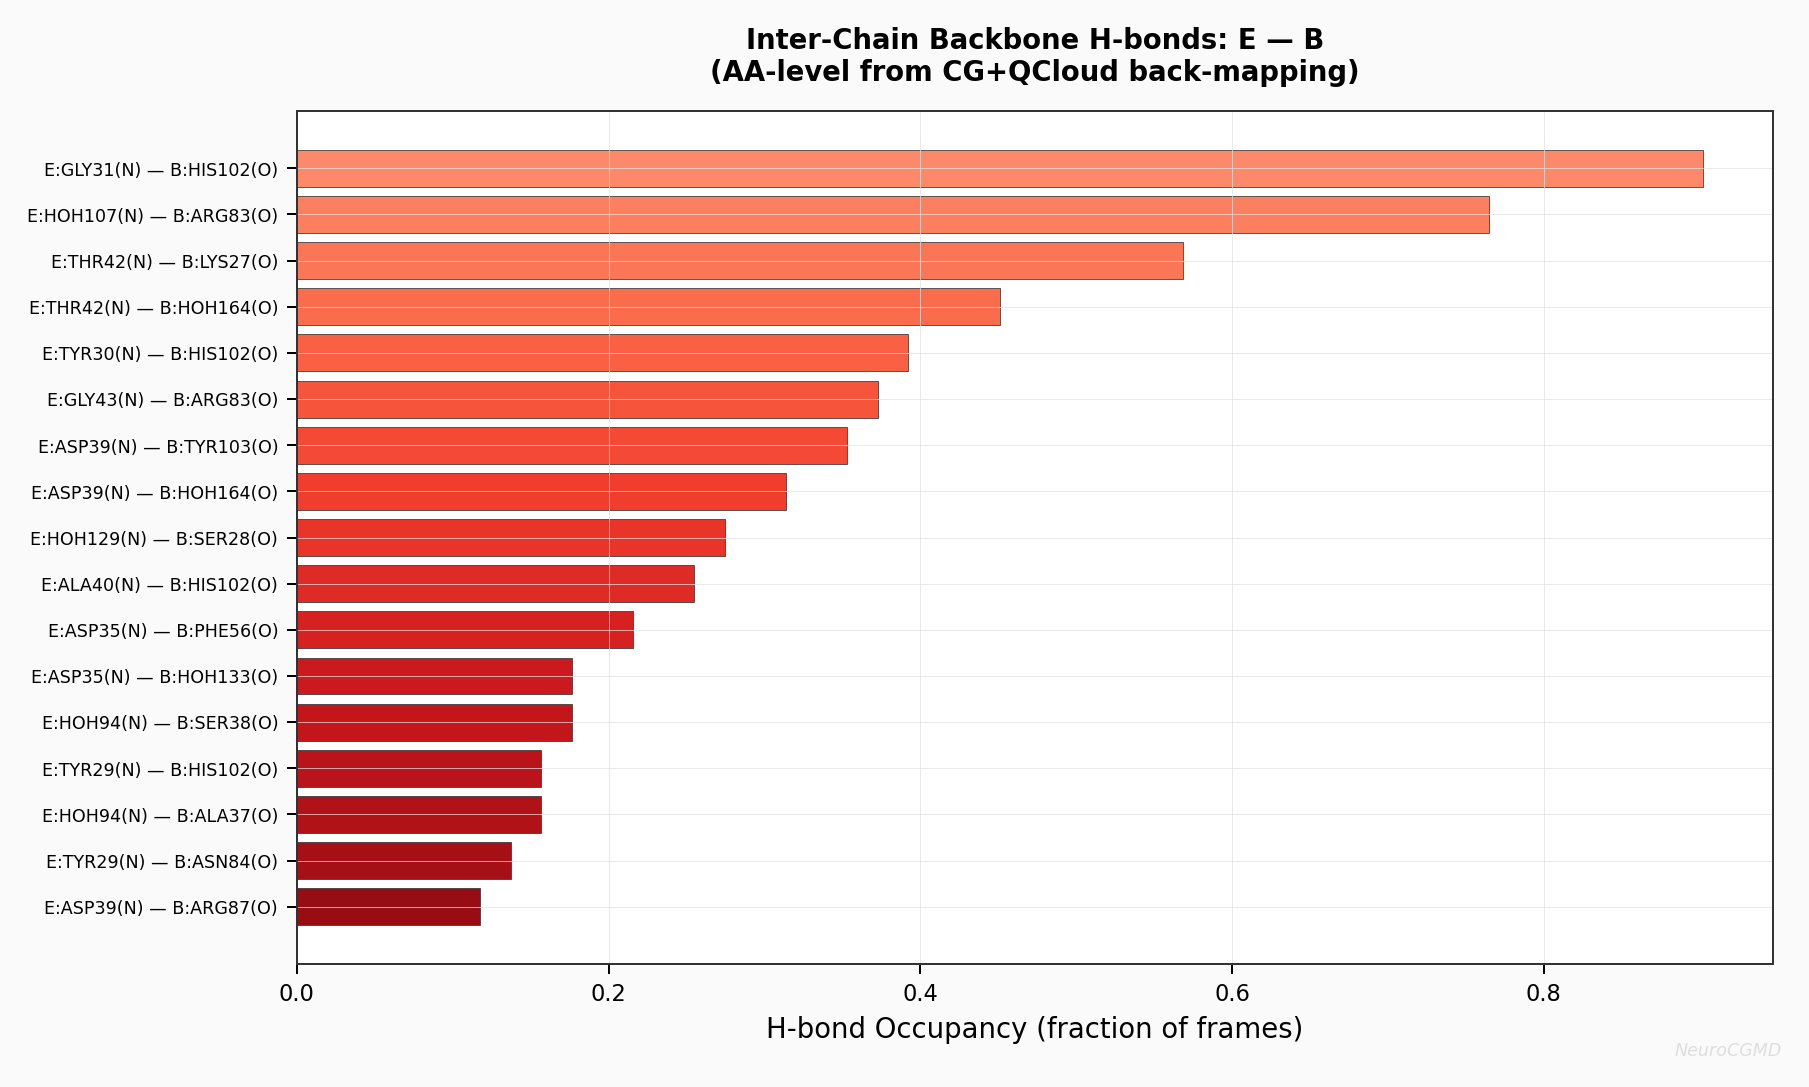
Inter-Chain H-bonds: Barstar (E) — Barnase (B)
Representative inter-chain hydrogen-bond view from the example workflow, detected on reconstructed AA coordinates using the documented geometric criteria.
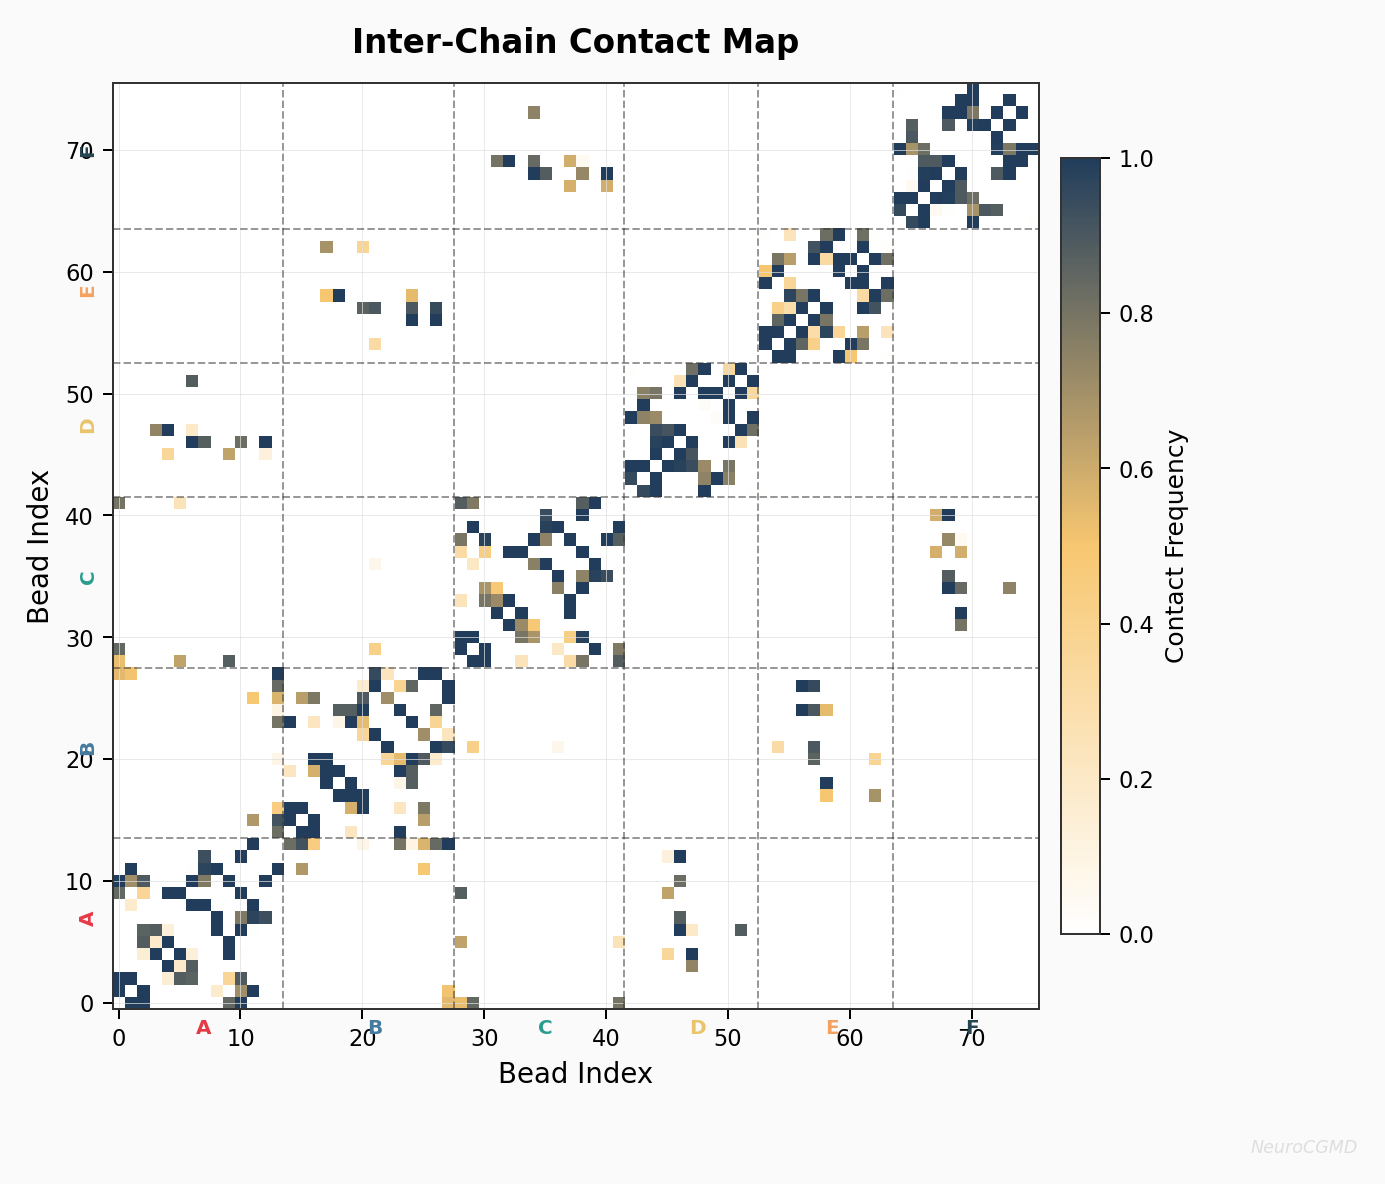
Inter-Chain Contact Map
Bead-level contact frequency map for the example complex. Dashed lines mark entity boundaries and the strongest regions indicate sustained interface contact in the example trajectory.
representative analysis products
▶ COMPLETE ANALYSIS OUTPUT — click any card to see details — generated from the documented run workflow
Energy & Thermodynamics
energy_timeseries.png
Potential, kinetic, and total energy time series confirming equilibration across NVT, NPT, and production stages.
Structural Stability
rmsd.png, rmsf.png
RMSD and RMSF summarize overall structural drift and relative flexibility across the example system.
Pair Correlations
rdf.png
Radial distribution function g(r) with characteristic peaks at bonded distances and LJ equilibrium.
Surface & Compactness
sasa_rg.png
Solvent-accessible surface area and radius of gyration evolution over the trajectory.
Free Energy
pmf.png, free_energy_landscape_2d.png
Potential of mean force from Boltzmann inversion of COM distance. 2D free energy landscape (COM distance vs Rg) with trajectory path overlay.
Reaction Coordinate
reaction_coordinate.png
Center-of-mass distance between binding partners across the example production stage.
AA Residue Contacts
aa_contact_map_*.png
Residue-residue contact frequency map derived from reconstructed coordinates.
Interface Pairs & H-bonds
aa_top_residue_pairs_*.png
Ranked interface residue pairs with contact frequency and hydrogen-bond overlay.
Per-Residue Binding
aa_residue_binding_contribution_*.png
Per-residue interface contribution profile with contact and hydrogen-bond components.
Energy Decomposition
energy_decomposition.png
Per-bead bonded, nonbonded, and total energy contribution across the CG representation.
Binding Dashboard
binding_dashboard.png
4-panel overview: COM distance, interface contacts, interaction energy, and binding correlation scatter.
Structure Snapshots
structure_snapshots.png
Representative XY projections from selected timepoints showing the evolution of the example complex.
output files
▶ OUTPUT FILES — all PDB files load in Chimera, VMD, or PyMOL
cg_trajectory.pdb
CG trajectory output
aa_backmapped_trajectory.pdb
Back-mapped atomistic trajectory output
energies.csv + run_summary.json
Data + metadata